
 Available in US
Content

I learned the 3-way moneyline the hard way during my second NHL season, on a Boston versus Toronto game where I had backed Boston at –115 on the conventional 2-way line. Game ended 2–2 after regulation, then Boston won 3–2 in overtime. My ticket cashed. A friend at the same pub, who had backed Boston on the 3-way at +130 because he liked the longer price, watched his bet lose because the draw box collected. Same outcome on the ice. Two different results on the slip. That’s the first thing you need to understand about this market.
An NHL 3-way moneyline is a wager priced across three possible outcomes — home win in regulation, draw after regulation, and away win in regulation — and it settles strictly on the score at the 60-minute buzzer. Overtime and shootouts don’t count for either team. The crucial difference from the standard 2-way moneyline is precisely that the draw is a live third outcome, which means winning odds are longer than they look on the conventional board, and you give up your win-conversion via overtime entirely.
The arithmetic of why this matters comes straight from the NHL’s own history: roughly 23.9% of NHL games end tied after regulation, with the result decided in the extra frame. Nearly one in four games. That’s a chunk of probability that the 3-way moneyline carves out as a separate priced outcome, leaving the two team lines noticeably longer than their 2-way equivalents. Reading those longer prices correctly is the whole game on this market.
How the three-way market works and where it diverges from the standard moneyline
Start with the mechanics. A 3-way moneyline always offers three prices: home team to win in regulation, draw, and away team to win in regulation. The book sets all three so the implied probabilities sum to slightly above 100%, with the overage being the operator’s margin. Settlement happens at the end of the third period. If the game is tied 2–2 after regulation, the draw collects whether the eventual winner is decided in overtime or shootout.
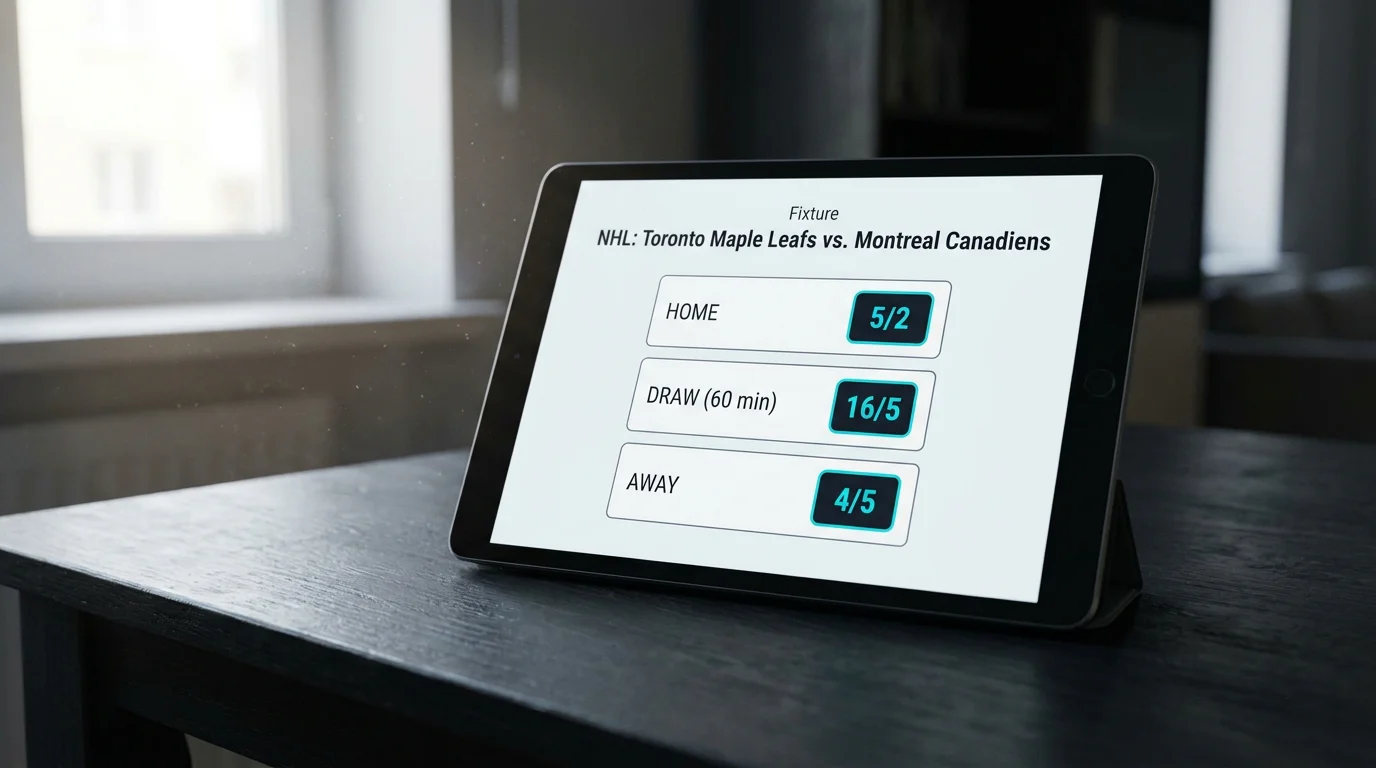
The pricing relationship between 2-way and 3-way is where punters get confused. Take a hypothetical match where the 2-way moneyline shows Boston at 4/6 and Toronto at 6/5. The same match might appear on the 3-way board with Boston at evens (1/1), the draw at 11/4, and Toronto at 13/8. The home team has gone from 4/6 to evens, the away team from 6/5 to 13/8, and the draw has been priced as its own box. When professional analysts call a team a +125 moneyline bet — as Sportsbook Review’s Dustin Saracini did about Vegas during the 2026 Stanley Cup run, arguing the Golden Knights at that price were as good a bet as any — they are operating in 2-way pricing. The corresponding 3-way price on the same team is a different number entirely, often a longer one, because the overtime and shootout conversion has been stripped out of the calculation.
The settlement boundary is brutally simple. If the game ends 3–2 in regulation, the 3–2 side wins outright. If it ends 2–2 in regulation and goes to overtime, the draw collects regardless of who eventually scores. If it ends in any score after regulation that isn’t a tie, the regulation winner collects. There is no half-win, no push, no refund for “tied at the buzzer but won the game”. The boundary is the third-period horn.
This is why I treat the 3-way as a slightly different product family from the 2-way. The full settlement rules for 60-minute markets are covered in my piece on betting the 60-minute hockey result, and the 3-way is essentially the most popular member of that family — but understanding how each variant treats overtime is essential before you place a single ticket.
When the three-way is the right tool for the matchup
The 3-way moneyline shines in three specific scenarios. The first is when you have strong conviction on a regulation result and don’t want to give up your edge to the overtime coin-toss. Overtime in the NHL is 3-on-3 hockey, which converts close to 60–40 in favour of whichever team holds the first significant possession. If you fancy a home favourite to control 60 minutes but you don’t fancy them in a 3-on-3 sprint, the 3-way lets you price your view cleanly.
The second is when you want longer odds on a side you’d otherwise back at a short 2-way price. A team you’d take at 4/6 on the 2-way might appear at 11/10 on the 3-way, giving you a roughly 60% effective price improvement, with the trade-off being you forfeit your win-conversion via overtime. Whether that trade is worth taking depends on the team’s specific overtime profile across the season — top conversion teams in 3-on-3 are worse 3-way bets than poor 3-on-3 teams at equivalent 2-way prices.

The third is when you have a specific opinion on the draw itself. Most NHL matches at home-ice advantage hand the host team a 54% moneyline win rate across a season, but that figure includes overtime and shootout wins. The regulation home win rate is several points lower, and the regulation draw rate rises accordingly when two evenly-matched teams meet. Identifying matchups likely to be tight at the third-period horn is its own skill, and the 3-way is the only market that pays it.
I rarely use the 3-way when I have a soft moneyline opinion on a team that wins games narrowly in any fashion. That kind of view is exactly the conventional 2-way’s bread and butter; switching to the 3-way for a longer price strips away the very conversion paths the view depends on.
The 23.9% draw rate and what it means for pricing
About 23.9% of NHL games over the past two decades have ended tied after regulation. That number is the entire foundation of the 3-way moneyline’s pricing structure, and reading it correctly matters more than any specific matchup analysis.
Convert it to fractional odds for a moment. A 23.9% true probability implies a fair price of roughly 16/5 — close to +320 in American terms. UK books typically hang the draw line shorter than that, around 11/4 or 3/1 (implied probability 25–27%), because the operator’s margin lives inside that probability gap. If you’re going to back the draw straight up, you need a model that says the regulation tie rate for the specific matchup is above 27%, not just above 24%. Otherwise you’re paying juice for an average outcome.

The pattern that pushes draw probability higher is intra-division mid-table matchups where neither side wants to give up positioning points. Both teams play conservative third periods, the pace falls, and a 2–2 game at the second intermission stays 2–2 through the buzzer. I keep a small set of matchups each season that I model as having a regulation-tie rate north of 28%, and those are the only games on which I’ll touch a straight draw bet.
The more common 3-way bet is on a team rather than the draw. The maths there is different — you’re betting that your team wins specifically in regulation, which means your edge calculation requires subtracting overtime conversion from the 2-way win probability. Top home teams convert in overtime at 50–55% rates; weaker teams sit at 45–50%. A 3-way bet on a team that converts well in overtime gives up genuine value, because you’re paying a longer price for a win path you forfeit. Conversely, a 3-way bet on a regulation-strong but overtime-weak team can be quietly profitable, because the longer price compensates for an overtime conversion you wouldn’t have captured anyway.
The draw isn’t usually the bet. The reading of which team is paying you correctly for their regulation strength versus their overtime conversion is the bet.
What UK sportsbooks offer on three-way NHL markets
Three-way moneyline coverage on NHL has been standard on UKGC-licensed sportsbooks since the early 2010s, when the market moved from being a European-only quirk into a routine part of the UK board. Most major operators publish 3-way prices alongside the 2-way for every regular-season match and every playoff game, though the depth of in-play 3-way liquidity varies operator to operator.
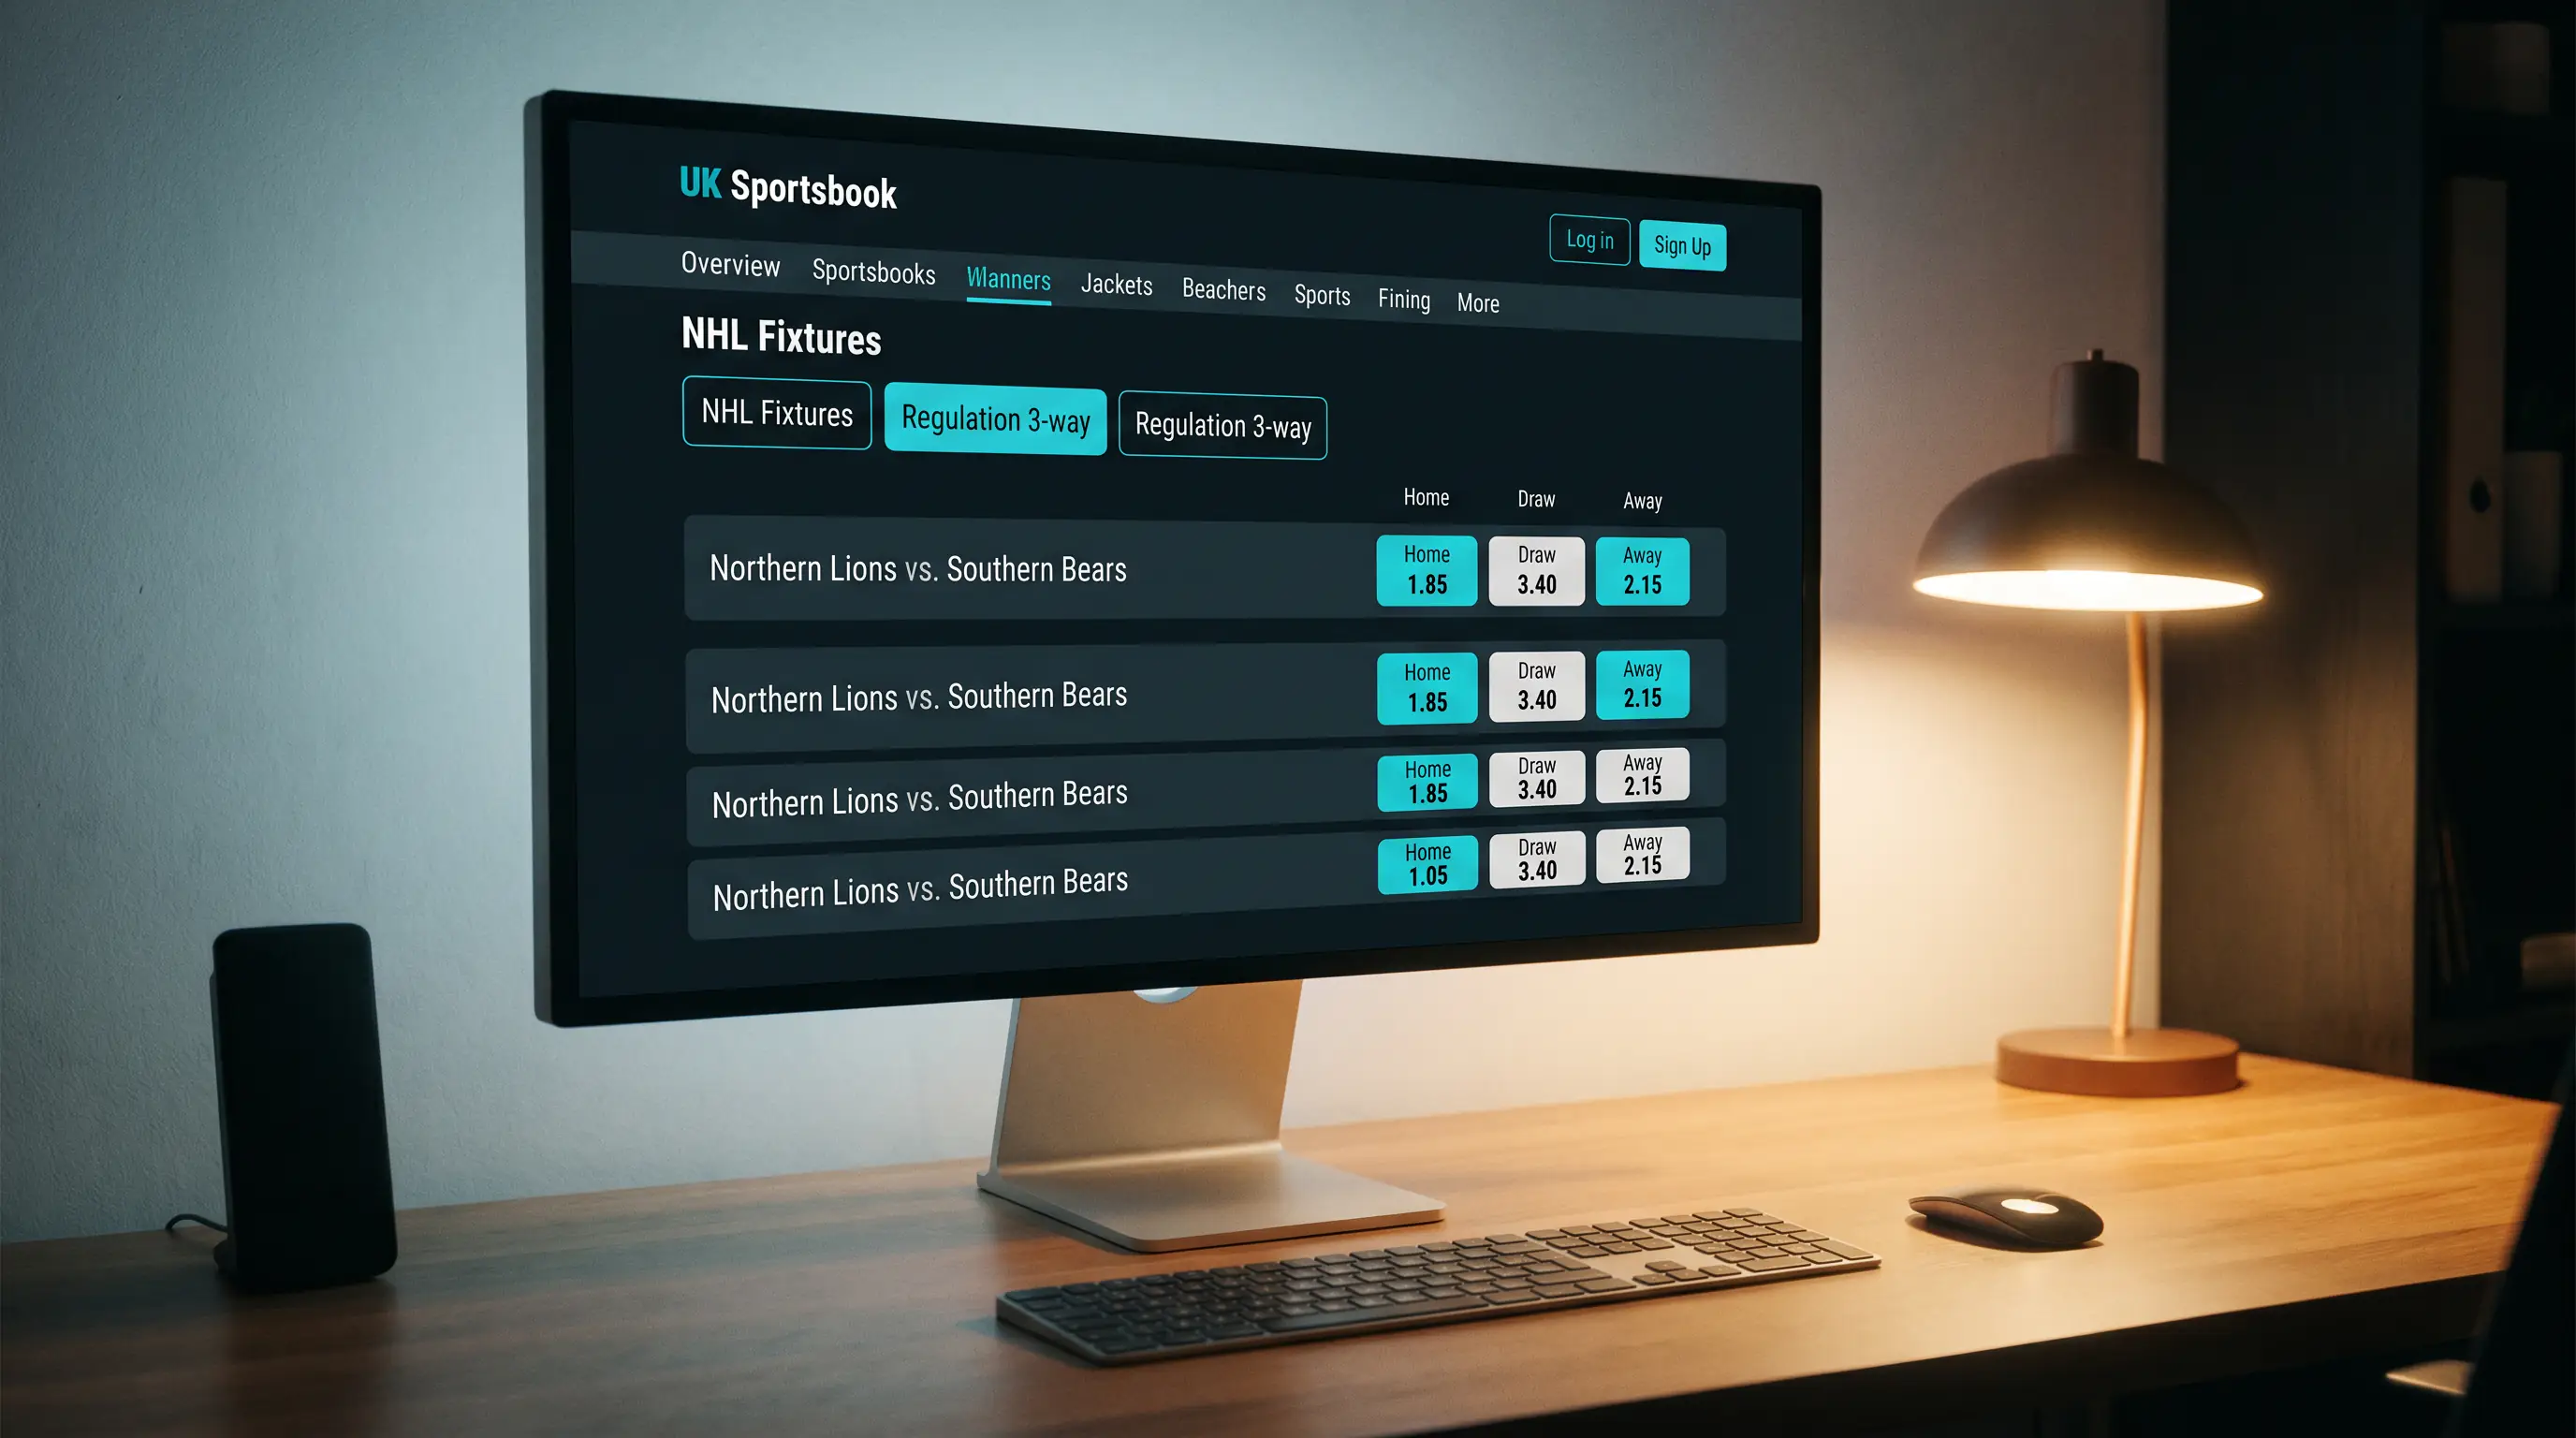
The juice on 3-way markets is typically larger than on 2-way because the book is hedging three exposures rather than two. A standard 3-way might run with an implied total probability around 105–107%, versus 103–105% on the equivalent 2-way. The difference is small in any single bet, but it compounds across volume, which is why long-term 3-way punters need to be more selective than they would be on the conventional moneyline.
Live and in-play 3-way markets exist on most UK books, though they are usually suspended for periods of high uncertainty — extended power plays, immediately after goals, during reviewable plays. The suspension windows tend to be short, but they can be frustrating if your live betting model relies on entering the market at a specific game state. I generally don’t recommend live 3-way for inexperienced punters; the pricing moves quickly enough that the spread between operators can become significant within seconds, and you need a multi-book setup to capture meaningful edge.
UK operators differ on settlement timing. Some publish 3-way results within seconds of the third-period buzzer; others wait until the full match is complete, which can delay your wallet balance by an hour or more if you’re holding multiple positions across a busy night. None of this affects the bet outcome — it’s a workflow consideration, not an edge issue — but it matters if you’re sizing into the next day’s slate based on funds returning.
My three-way checklist before any ticket
Three filters decide whether the 3-way is the right product for a given matchup. First, do I have a regulation-specific opinion, or just a general view on who wins the hockey game in any fashion — if the answer is general, the 2-way is the right market. Second, what is my team’s overtime conversion rate, and am I paying a long enough 3-way price to be compensated for forfeiting that conversion. Third, does my matchup specifically suggest a regulation-tie rate above the implied 25–27% baked into the draw price — and if so, can I quantify that without overconfidence. If all three filters return clean answers, the 3-way is the right tool. If any one returns ambiguous, I bet the 2-way instead. The 23.9% draw rate is the gravitational constant of this market, and respecting it is the difference between sustainable 3-way punting and slow leakage of a bankroll.

Why are NHL 3-way moneyline prices longer than the 2-way?
The 3-way carves the draw out as its own priced outcome, which removes the overtime and shootout win paths from the team prices. With roughly 23.9% of NHL games ending tied after regulation, that draw probability gets shifted out of the two team lines, leaving both prices longer than they appear on the 2-way board. A 2-way favourite at 4/6 typically shows on the 3-way around evens or 11/10.
How is a 3-way moneyline graded if a game ends tied after regulation?
The draw collects regardless of who eventually wins in overtime or shootout. If the regulation scoreline reads 2-2 at the third-period buzzer, the draw box wins and both team bets lose. The eventual winner is irrelevant to settlement, which is the entire reason the 3-way exists as a separate market from the standard 2-way moneyline.
Which UK bookmakers consistently offer NHL 3-way moneyline markets?
Most major UKGC-licensed sportsbooks publish 3-way moneyline prices alongside the 2-way for every regular-season and playoff match. Coverage is universal across the largest operators, though in-play 3-way liquidity varies — some books offer full live coverage, others suspend the market more aggressively during high-uncertainty periods like extended power plays or immediately after goals.
