
 Available in US
Content

Home ice advantage in NHL betting is the statistically measurable edge enjoyed by the home team across the 1,312 regular-season matches played each year — and it lands almost exactly at 54 percent on the moneyline. That number sounds modest until you sit with it for a few minutes. A 54 percent winrate over 656 home games a season is the kind of structural edge that, blindly bet at fair price, would chew through any sportsbook’s risk model in a week. It does not, of course, because the market prices that edge in. Home favourites already cost you the juice, home dogs already get nudged shorter than their road performance would suggest. The question is not whether home ice exists — the data settles that — but where the market under-prices or over-prices it.
I have spent nine years building NHL totals models and goaltender prop pricing, and home advantage is one of the few variables where I am willing to make a baseline assumption before any other data lands. The home team enters every game with roughly 0.28 expected goals of structural advantage and a 54 percent moneyline winrate baked in. That assumption is the starting point. Where the value lives is in the games where the market either forgets that edge exists or stretches it past what the matchup justifies. This article walks through how home edge is actually measured, where it shows up most reliably, and the matchup contexts where I refuse to lean on it.
Measuring the NHL home edge
The cleanest demonstration I ever saw of home edge came not from a model, but from an old Excel sheet a colleague kept of every NHL regular-season game from 2015 to 2023. He sorted by venue, ran averages, and showed me the same number every season — roughly 0.28 goals of differential favouring the home team, give or take 0.03 in any given year. That is the structural edge before any team-specific quality adjustment. Goal differential of that size, applied across an 82-game home schedule, projects to about 23 extra goals scored by an average home team versus what they would post on the road. Across the league, that is the structural baseline that produces the 54 percent home moneyline winrate.
Where does that 0.28-goal edge come from? Three components I trust. The last-change rule, where the home team’s coach gets the final line decision after every whistle, is worth somewhere around 0.10 to 0.12 goals per game on its own. Officiating shows a measurable home bias on minor penalty rates that adds another tenth of a goal in shot-quality terms. Rest and travel residuals account for the remainder. You cannot reliably isolate each of those components in any single game, but in aggregate they produce the home edge that has held remarkably steady across rule changes, COVID-era empty buildings, and roster expansion to 32 teams.

Home favourites versus home underdogs
The most useful asymmetry I have found in this data is how home favourites and home underdogs behave against the puck line spread. Home underdogs at +1.5 cover the puck line 63.9 percent of the time — a figure that has been remarkably consistent over the past several seasons. That is not the same as winning the moneyline. It is the cover rate on the +1.5 spread, meaning the home dog either wins outright or loses by exactly one goal. Combine the structural home edge with the fact that underdogs in hockey rarely lose by two or more — empty-net goals are the swing factor — and you have a market that prices home dog +1.5 in a relatively narrow band.
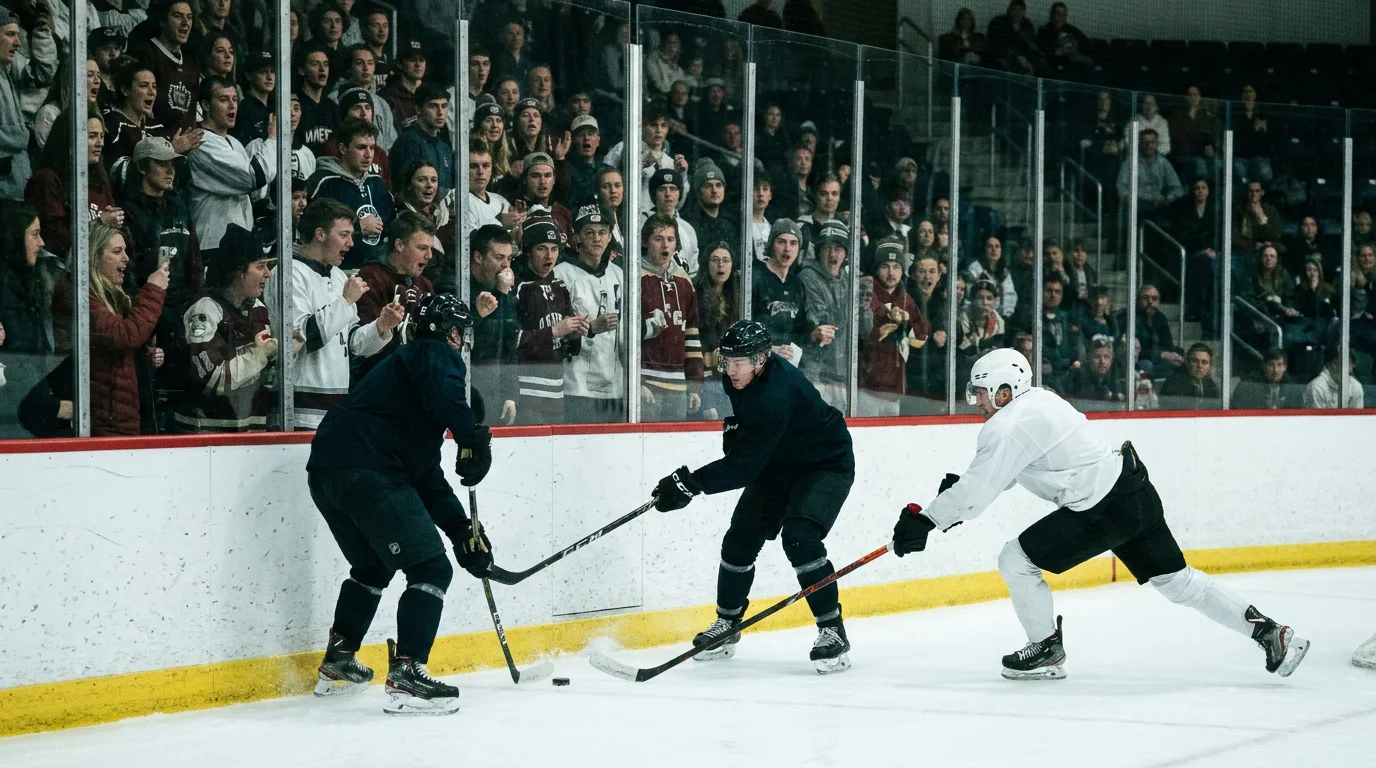
Home favourites are a different story. The market knows home favs win 54 percent of all games and prices them accordingly. Where I think the public misreads home favs is in big-favourite spots — minus 200 or shorter on the moneyline at home. The market assumes the home edge stacks linearly on top of team quality, but in practice the very best home teams hit a ceiling around 65 to 67 percent winrate on big-favourite home tickets. Paying minus 220 for a 65 percent shot is a slow bleed. I have far better luck looking at home moderate favourites, minus 130 to minus 160, where the implied probability and the actual winrate line up more honestly, and the structural edge does its work without the market pricing it twice.
When home ice is overrated
The first time I lost a meaningful sum chasing home ice was a Vancouver home game on a Wednesday night in February. The Canucks were minus 170 at home off two days of rest. They had been a clear playoff team. They lost 5 to 1. The detail I had ignored — and that I now check first on every home favourite ticket — was that Vancouver had been on the road for the previous nine days, returning home at 3 a.m. on the morning of the game. The home edge is real, but it is contingent on the home team actually getting the rest and travel benefits the edge is built on. When the home team has just landed off a long road swing, the building advantage is doing very little to offset the fatigue.
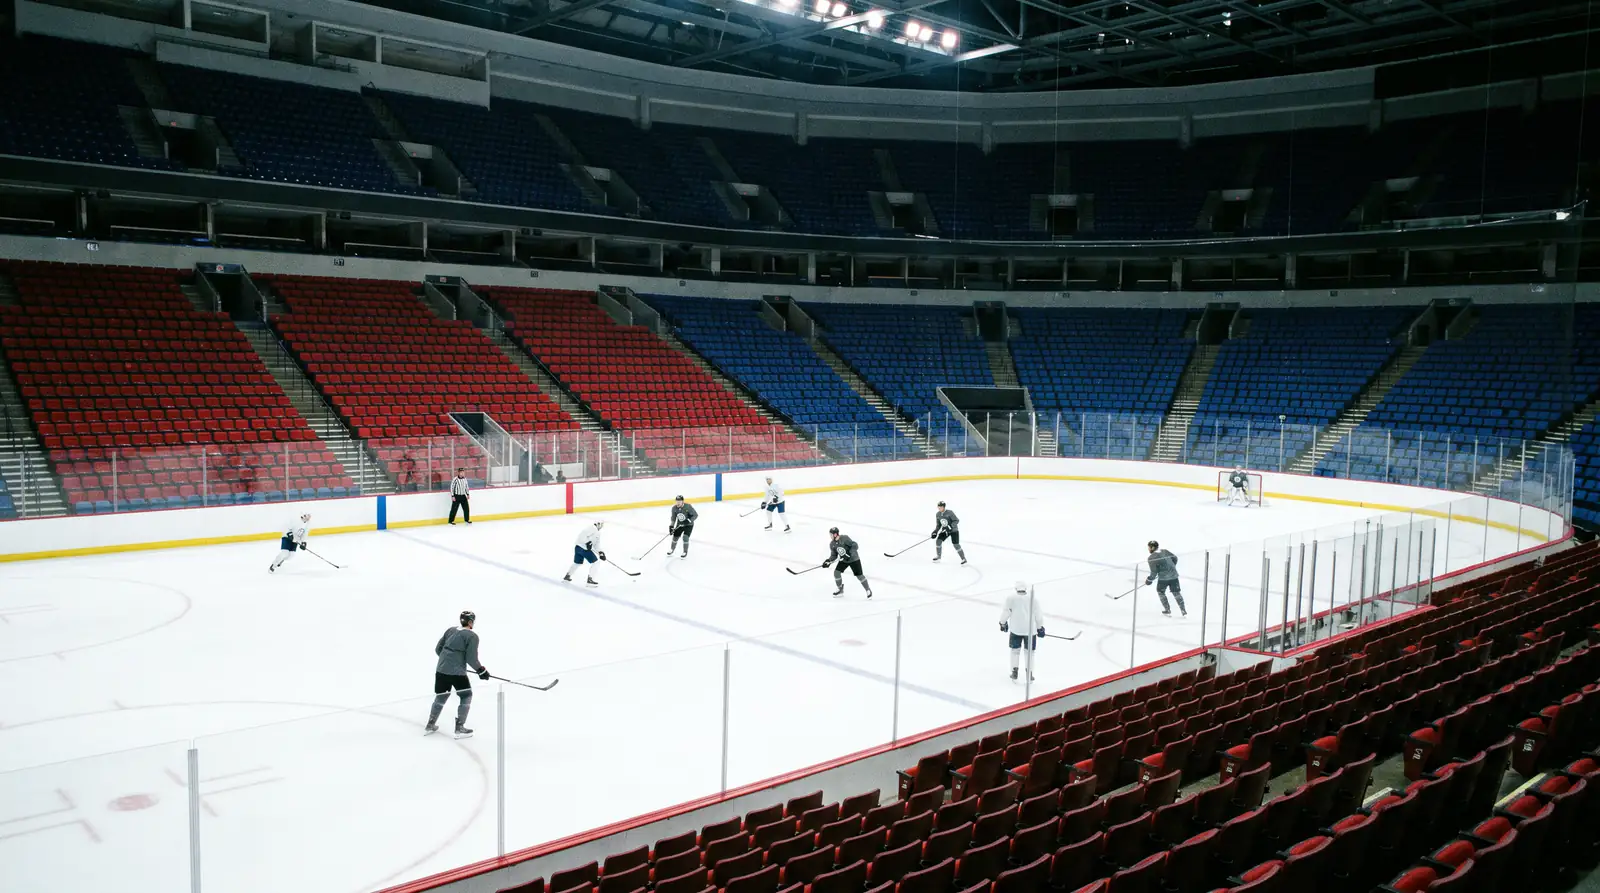
The second context where home ice is overrated is in second-half-of-season divisional games, when both teams have seen each other multiple times and the matchup quirks the home coach normally exploits with last change are well understood by the visiting bench. The edge does not disappear, but it shrinks measurably. I would estimate the structural home edge in late-season divisional rematches at closer to 0.15 goals than 0.28, which changes the price I am willing to pay on home favs in those games by enough to make me pass on tickets I would otherwise take. None of this is exotic — it is just refusing to apply the season-long average to specific matchup contexts where it does not hold.
Travel and rest as the home edge multiplier
Travel is the variable that decides whether home ice plays at full strength or at half power, and it is the single most reliable filter I run on home moneyline tickets. The NHL schedule is brutal — coast-to-coast trips, three games in four nights, time-zone changes — and the home team’s structural edge is roughly doubled when the visiting team is on the second night of a back-to-back. That is not a small effect. A home team that would normally be a 54 percent moneyline shot becomes closer to 60 percent when the visitors are on the second leg of a B2B and have travelled, and the market frequently underprices that combination. I write about how to read those fatigue spots specifically in my piece on spotting fatigue edges on the second night of an NHL back-to-back, because the multiplier between home ice and visitor fatigue is large enough to be its own betting angle.

The mirror image matters too. When the home team has had three or more days off and the visitors arrive on rested legs from a one-game road trip, the home edge is roughly normal but no greater. The market sometimes prices that scenario as if the home team’s rest advantage is a separate factor on top of home ice. It is not — rest mostly affects the team that is on the wrong end of the schedule. Layering rest on top of home edge as a betting argument double-counts the same effect, and that is the kind of small-but-persistent pricing error I look for on a four-game NHL slate.
The three home-ice questions I run before every ticket
Across nine years of NHL work, the home-ice angle has paid me back the most when I treated it as a starting hypothesis to be tested, not a fixed input. Three questions decide whether I lean on it for a given ticket. First, did the home team actually benefit from the schedule that produced this game, or are they just nominally at home after a brutal road swing? Second, is the visiting team on a fatigue spot that doubles the structural edge, or are they rested and ready? Third, is the price the market is offering accounting for the season-long 0.28-goal edge already, or am I about to pay for it twice? Three honest answers, and the home-ice ticket either makes itself or quietly removes itself from the slate.

Why is NHL home ice advantage worth roughly 0.28 goals per game?
It aggregates the last-change rule, a small officiating bias on minor penalty rates, and rest plus travel residuals favouring the home team. Each contributes between 0.06 and 0.12 goals, totalling the steady 0.28 figure across recent seasons.
Are NHL home favourites or home underdogs the better ATS play?
Home underdogs at plus 1.5 cover 63.9 percent of the time, a clean structural edge; home favourites are priced honestly in moderate ranges but tend to underperform at minus 200 or shorter.
